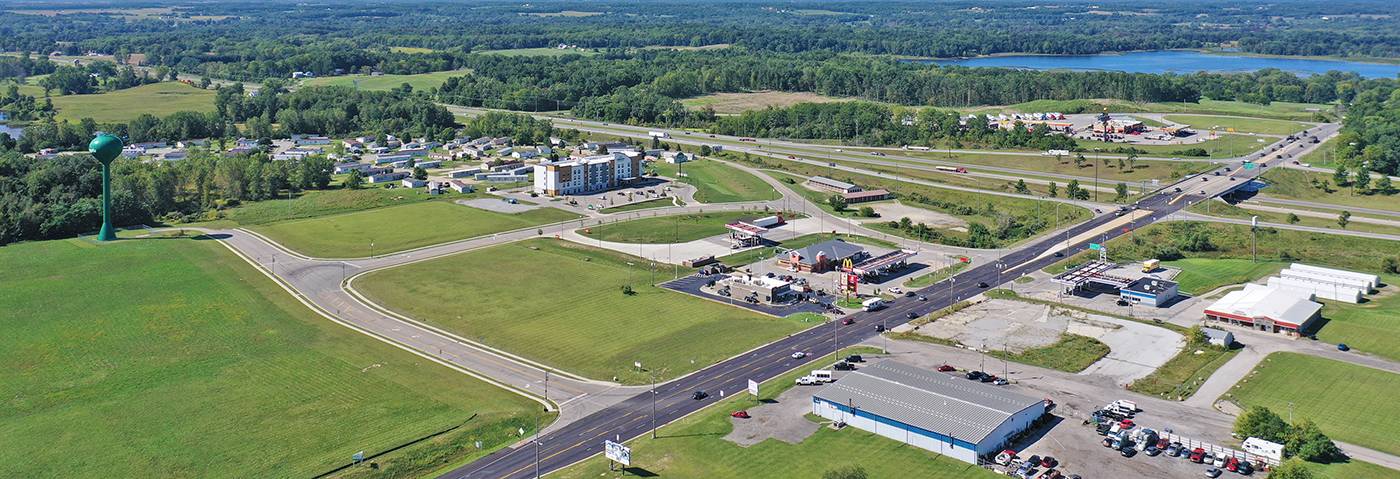
Steuben County, IN
Population
Back To Top
Population
| Population | 2000 | 2010 | 2023 | 2028 |
|---|---|---|---|---|
| Steuben County, IN | 33,214 | 34,185 | 34,362 | 34,330 |
Source: ESRI, 2023-10-17
Population by Age
| Population | 2010 | 2023 | 2028 |
|---|---|---|---|
| 0-4 | 1,888 | 1,627 | 1,624 |
| 5-9 | 2,169 | 1,828 | 1,786 |
| 10-14 | 2,256 | 1,894 | 1,905 |
| 15-19 | 2,768 | 2,731 | 2,614 |
| 20-24 | 2,356 | 2,209 | 2,176 |
| 25-29 | 1,708 | 1,902 | 1,624 |
| 30-34 | 1,786 | 1,988 | 1,918 |
| 35-39 | 2,078 | 2,005 | 2,161 |
| 40-44 | 2,243 | 2,036 | 2,029 |
| 45-49 | 2,512 | 1,909 | 2,024 |
| 50-54 | 2,588 | 2,166 | 1,976 |
| 55-59 | 2,520 | 2,506 | 2,307 |
| 60-64 | 2,223 | 2,448 | 2,315 |
| 65-69 | 1,747 | 2,457 | 2,408 |
| 70-74 | 1,245 | 2,005 | 2,104 |
| 75-79 | 893 | 1,310 | 1,654 |
| 80-84 | 628 | 758 | 994 |
| 85+ | 577 | 583 | 711 |
| 18+ | 26,350 | 27,732 | 27,797 |
| Median Age | 40 | 42 | 43 |
Source: ESRI, 2023-10-17
Population by Race
| Steuben County, IN | 2023 |
|---|---|
| Total | 34,362.00 |
| White Alone | 91.84 |
| Black Alone | 0.72 |
| American Indian Alone | 0.33 |
| Asian Alone | 0.62 |
| Pacific Islander Alone | 0.01 |
| Some Other Race | 2.21 |
| Two or More Races | 4.28 |
| Hispanic Origin | 4.55 |
| Diversity Index | 22.80 |
Source: ESRI, 2023-10-17
Growth Rate
| Steuben County, IN | 2023 - 2028 |
|---|---|
| Population | -0.02% |
| Households | 0.21% |
| Families | 0.17% |
| Median Household Income | 3% |
| Per Capita Income | 3% |
Source: ESRI, 2023-10-17
Back To TopHousing
Back To Top
Households
| Population | 2000 | 2010 | 2023 | 2028 |
|---|---|---|---|---|
| Households | 12,738 | 13,310 | 13,839 | 13,988 |
| Housing Units | 17,337 | 19,377 | 18,853 | 18,864 |
| Owner Occupied Units | 10,962 | 11,162 | ||
| Renter Occupied Units | 2,877 | 2,826 | ||
| Vacant Units | 5,014 | 4,876 |
Source: ESRI, 2023-10-17
Home Value
| Steuben County, IN | 2023 | 2028 |
|---|---|---|
| Median Home Value | $213,451 | $236,304 |
| Average Home Value | $269,356 | $286,342 |
| <$50,000 | 699 | 629 |
| $50,000 - $99,999 | 998 | 895 |
| $100,000 - $149,999 | 1,577 | 1,425 |
| $150,000 - $199,999 | 1,878 | 1,699 |
| $200,000 - $249,999 | 1,223 | 1,285 |
| $250,000 - $299,999 | 926 | 973 |
| $300,000 - $399,999 | 1,744 | 2,035 |
| $400,000 - $499,999 | 913 | 1,067 |
| $500,000 - $749,999 | 586 | 681 |
| $1,000,000 + | 62 | 68 |
Source: ESRI, 2023-10-17
Housing Year Built
| Year Range | Houses Built |
|---|---|
| 2010 or Later | 1,188 |
| 2000-2009 | 2,649 |
| 1990-1999 | 3,522 |
| 1980-1989 | 2,019 |
| 1970-1979 | 2,300 |
| 1960-1969 | 1,404 |
| 1950-1959 | 1,268 |
| 1940-1949 | 970 |
| 1939 or Before | 3,592 |
Source: ESRI, 2023-10-17
Back To TopIncome
Back To Top
Income
| Steuben County, IN | 2023 | 2028 |
|---|---|---|
| Median Household | $66,609 | $77,118 |
| Average Household | $91,307 | $103,709 |
| Per Capita | $36,866 | $42,349 |
Source: ESRI, 2023-10-17
Household Income Base
| Steuben County, IN | 2023 |
|---|---|
| <$15,000 | 825 |
| $15,000 - $24,999 | 1,151 |
| $25,000 - $34,999 | 932 |
| $35,000 - $49,999 | 1,855 |
| $50,000 - $74,999 | 2,891 |
| $75,000 - $99,999 | 1,724 |
| $100,000 - $149,999 | 2,730 |
| $150,000 - $199,999 | 1,020 |
| $200,000+ | 711 |
Source: ESRI, 2023-10-17
Back To TopEmployees
Back To Top
Commute
| Category | Commuters |
|---|---|
| Workers 16+ | 16,195 |
| In-County Residents | 10,756 |
| Out-of-County Residents | 4,374 |
| Drive Alone | 13,367 |
| Carpooled | 1,493 |
| Public Transport | 26 |
| Work at Home | 633 |
| Less than 5 minutes | 1,077 |
| 5-9 minutes | 2,387 |
| 10-14 minutes | 3,099 |
| 15-19 minutes | 2,294 |
| 20-24 minutes | 1,792 |
| 25-29 minutes | 719 |
| 30-34 minutes | 1,350 |
| 35-39 minutes | 369 |
| 40-44 minutes | 361 |
| 45-59 minutes | 1,039 |
| 60-89 minutes | 638 |
| 90+ minutes | 437 |
| Average Travel Time | 22 |
Source: ESRI, 2023-10-17
Source: ESRI, 2023-10-17
Employees by NAICS
| Category | Number |
|---|---|
| Total Employees | 18,349 |
| Agr/Forestry/Fish/Hunt | 61 |
| Mining | 0 |
| Utilities | 116 |
| Construction | 509 |
| Manufacturing | 5,135 |
| Wholesale Trade | 1,611 |
| Retail Trade | 2,258 |
| Motor Veh/Parts Dealers | 329 |
| Furn & Home Furnish Str | 82 |
| Electronics & Appl Store | 4 |
| Bldg Matl/Garden Equip | 221 |
| Food & Beverage Stores | 263 |
| Health/Pers Care Stores | 96 |
| Gasoline Stations | 309 |
| Clothing/Accessory Store | 69 |
| Sports/Hobby/Book/Music | 181 |
| General Merchandise Str | 704 |
| Misc Store Retailers | 0 |
| Nonstore Retailers | 0 |
| Transportation/Warehouse | 497 |
| Information | 288 |
| Finance & Insurance | 339 |
| Cntrl Bank/Crdt Intrmdtn | 193 |
| Sec/Cmdty Cntrct/Oth Inv | 41 |
| Insur/Funds/Trusts/Other | 105 |
| Real Estate/Rent/Leasing | 374 |
| Prof/Scientific/Tech Srv | 448 |
| Legal Services | 64 |
| Mgmt of Comp/Enterprises | 2 |
| Admin/Support/Waste Mgmt | 156 |
| Educational Services | 1,209 |
| HealthCare/Social Assist | 1,592 |
| Arts/Entertainment/Rec | 251 |
| Accommodation/Food Srvcs | 2,059 |
| Accommodation | 616 |
| Food Srv/Drinking Places | 1,443 |
| Other Srv excl Pub Admin | 957 |
| Auto Repair/Maintenance | 293 |
| Public Administration Emp | 450 |
Source: ESRI, 2023-10-17
Educational Attainment (25+)
| Steuben County, IN | 2023 |
|---|---|
| Some High School | 1,086 |
| Graduated High School | 8,468 |
| Associates Degree | 2,641 |
| Bachelor's Degree | 3,983 |
| Graduate Degree | 1,923 |
Source: ESRI, 2023-10-17
Back To TopBusinesses
Back To Top
Businesses by NAICS
| Category | Number |
|---|---|
| Total Businesses | 1,417 |
| Agr/Forestry/Fish/Hunt Bus | 19 |
| Mining Bus | 0 |
| Utilities Bus | 9 |
| Construction Bus | 107 |
| Manufacturing Bus | 104 |
| Wholesale Trade Bus | 55 |
| Retail Trade Bus | 225 |
| Motor Veh/Parts Dealers Bus | 45 |
| Furn & Home Furnish Str Bus | 10 |
| Electronics & Appl Store Bus | 1 |
| Bldg Matl/Garden Equip Bus | 19 |
| Food & Beverage Stores Bus | 27 |
| Health/Pers Care Stores Bus | 14 |
| Gasoline Stations Bus | 21 |
| Clothing/Accessory Store Bus | 11 |
| Sports/Hobby/Book/Music Bus | 40 |
| General Merchandise Str Bus | 37 |
| Misc Store Retailers Bus | 0 |
| Nonstore Retailers Bus | 0 |
| Transportation/Warehouse Bus | 37 |
| Information Bus | 22 |
| Finance & Insurance Bus | 77 |
| Cntrl Bank/Crdt Intrmdtn Bus | 31 |
| Sec/Cmdty Cntrct/Oth Inv Bus | 18 |
| Insur/Funds/Trusts/Other Bus | 28 |
| Real Estate/Rent/Leasing Bus | 79 |
| Prof/Scientific/Tech Srv Bus | 81 |
| Legal Services Bus | 17 |
| Mgmt of Comp/Enterprises Bus | 1 |
| Admin/Support/Waste Mgmt Bus | 39 |
| Educational Services Bus | 30 |
| HealthCare/Social Assist Bus | 98 |
| Arts/Entertainment/Rec Bus | 29 |
| Accommodation/Food Srvcs Bus | 116 |
| Accommodation Bus | 24 |
| Food Srv/Drinking Places Bus | 92 |
| Other Srv excl Pub Admin Bus | 189 |
| Auto Repair/Maintenance Bus | 34 |
| Public Administration Bus | 55 |
Source: ESRI, 2023-10-17
Back To Top